You see what we see!
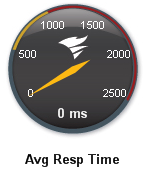
As part of the network management service, Turnstone runs an advanced management tool to monitor every facet of your network. Many customers are happy for us to monitor and manage their network for them. But others like to know what is happening and Network Monitor extends the user licence to give you full graphical access (via your user portal) to the same empirical information that we have. Using a web-based dashboard, you have visibility of four important network performance indicators: |

|
|
Network quality
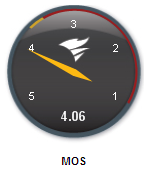
Each appliance on the customer network is set up on the monitoring system to record and display a number of important measurements which are proxies for network quality: CPU usage, memory utilisation, latency, throughput, and device uptime. The output of this combines to give the MOS value (mean opinion score).
|
 |
Network events
During a network outage, Network Monitor provides instant visibility of any affected appliances, and the status of the links in between. This is the same information we use to troubleshoot network faults, quickly diagnose corrective actions and so reduce the mean time to repair. Having this information gives you a better picture of any network events you may experience. This historical event information can then be used to support decisions regarding future changes to the network that would improve appliance stability and/or link performance such as resilient links, alternate carrier paths, and standby or failover devices. |

Click to enlarge
|
|
Link capacity
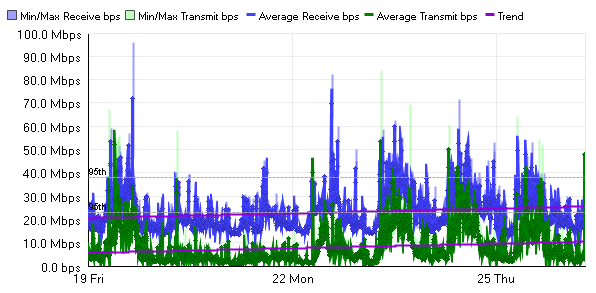
Trend information is used to model link capacity against average link utilisation. This is displayed graphically using statistical methods to indicate when links are becoming congested by increased traffic on your network. Using this information, decisions can be made to upgrade links or initiate checks on the origin of the extra traffic being generated - see traffic analysis below.
|

Click to enlarge
|
Traffic analysis
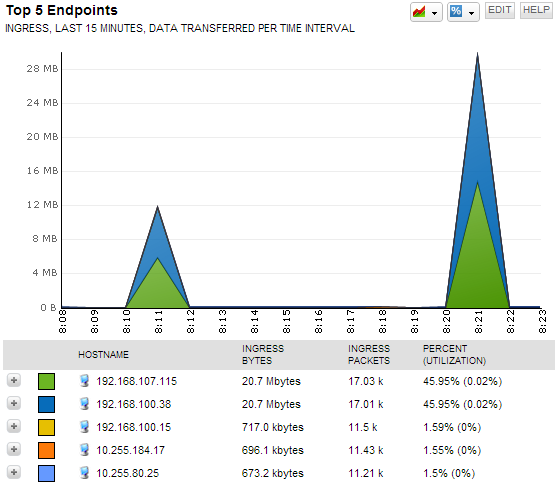
Users may be complaining about the network being slow. IT administrators traditionally have either had to check each host and destination device connected to the network in a process of elimination that might take weeks, or altenatively buy more bandwidth. With traffic analysis tools we can can find the device or user generating the extra traffic quickly, having visibility of bandwidth utilisation by traffic type (protocol), by host (internal IP address) and by destination (external IP address). This provides for quicker and more informed network decisions and better user experiences. |

Click to enlarge
|
Licence costs
Pricing from $10 per month (excl GST).
Volume price breaks and some conditions apply. |
